
WALT:
Collecting, displaying and interpreting data.
WILF:
All of you will be able to construct a graph with 2 axis.
Most of you will be able to use the correct scale.
Some of you will be able to interpret information from the graph and put into a sentence.
Collecting, displaying and interpreting data.
WILF:
All of you will be able to construct a graph with 2 axis.
Most of you will be able to use the correct scale.
Some of you will be able to interpret information from the graph and put into a sentence.

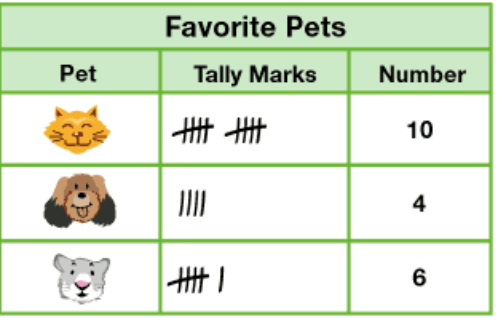
Collecting data:
Tallies are a great way to collect data. It enables you to skip count so you don't have to count each individual result.
TPS: What is a tally mark? When do you think you could use a tally system?
Tallies are a great way to collect data. It enables you to skip count so you don't have to count each individual result.
TPS: What is a tally mark? When do you think you could use a tally system?

Tables
When conducting a survey a table is helpful to organise your information.
When conducting a survey a table is helpful to organise your information.
WAGOLL
Brainstorm:
Why do people use surveys?
Where have we seen one in real life?
What survey could we conduct in our classroom?
Why do people use surveys?
Where have we seen one in real life?
What survey could we conduct in our classroom?

Create your own survey question.
Ask your peers and tally the results.
Ask your peers and tally the results.

Bar Graphs
Wagoll
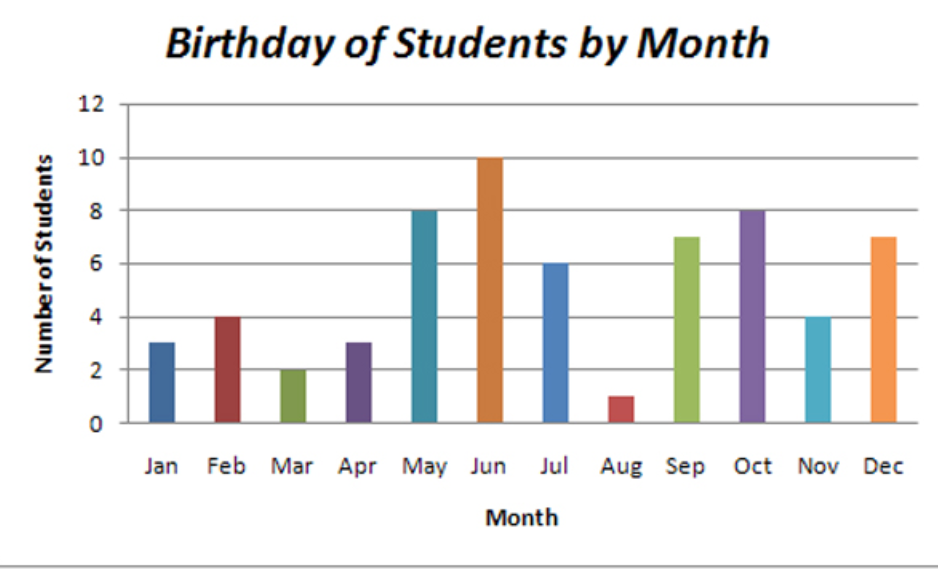
Looking at the WAGOLL above. In your learning team come up with the criteria for what makes a good bar graph.
Bar graph Criteria
A bar graph needs to include the following.
- Title of what your graph is showing.
- X and Y axis.
- Titles for your X and Y Axis.
- A scale on your Y Axis.
- Labelled items on your X axis.
- Bars showing data that have a space between.
- Title of what your graph is showing.
- X and Y axis.
- Titles for your X and Y Axis.
- A scale on your Y Axis.
- Labelled items on your X axis.
- Bars showing data that have a space between.

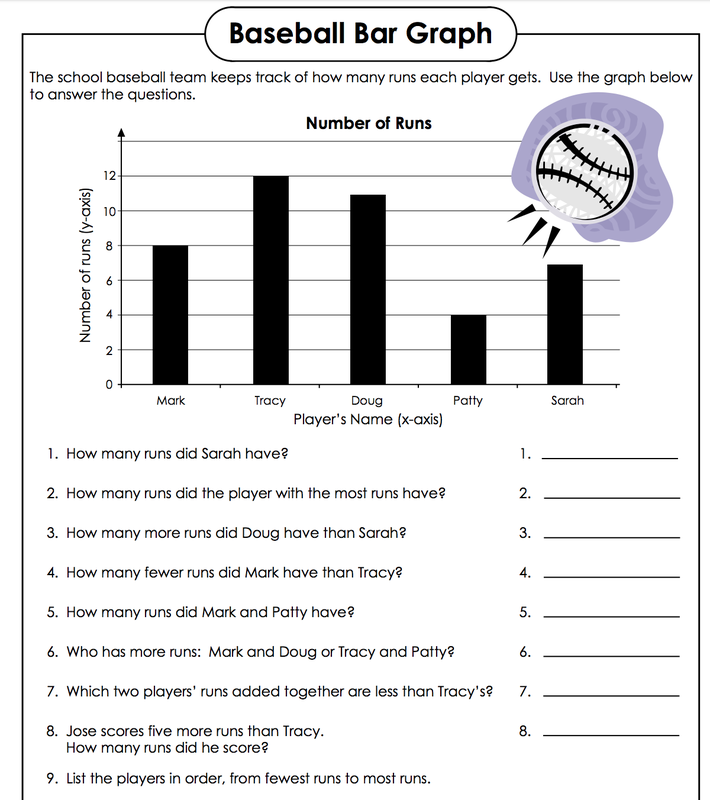
Using the tables above answer the questions in your maths books.
Choose 2 tables to create a bar graph from.
Choose 2 tables to create a bar graph from.
Survey Task
Your task:
Brainstorm some issues around our school community that you think you could change or improve.
Create a actionable question. Remember to be considered actionable you will need to have conclusion or some for of action that can be taken from your results.
Rule up a table.
Plan when next week are you going to conduct your survey? Who are the target audience for your survey?
Collect data - If you haven't done so yet, today poll our class.
Create bar graph for your data.
Draw conclusions.
- What does your data tell you?
- Who could your data help?
- Has your data lead to another question?
